Description
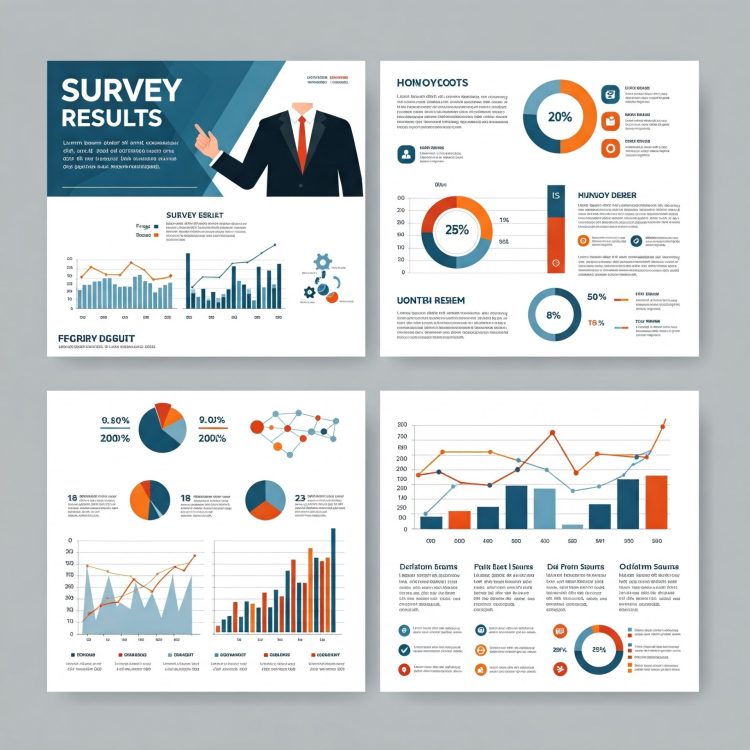
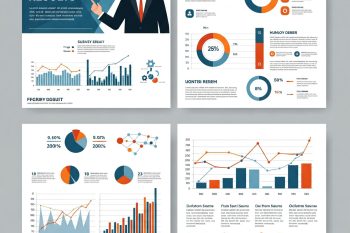
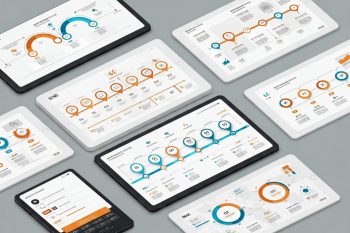
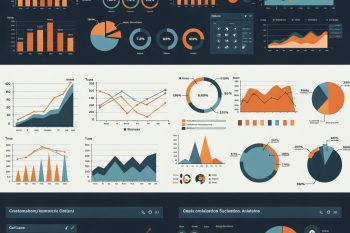
Simplify your data presentation with the Survey Results & Poll Data Infographics Kit. Designed for marketers, researchers, educators, and agencies, this pack helps you showcase audience insights, feedback, and polling results in a visually engaging way.
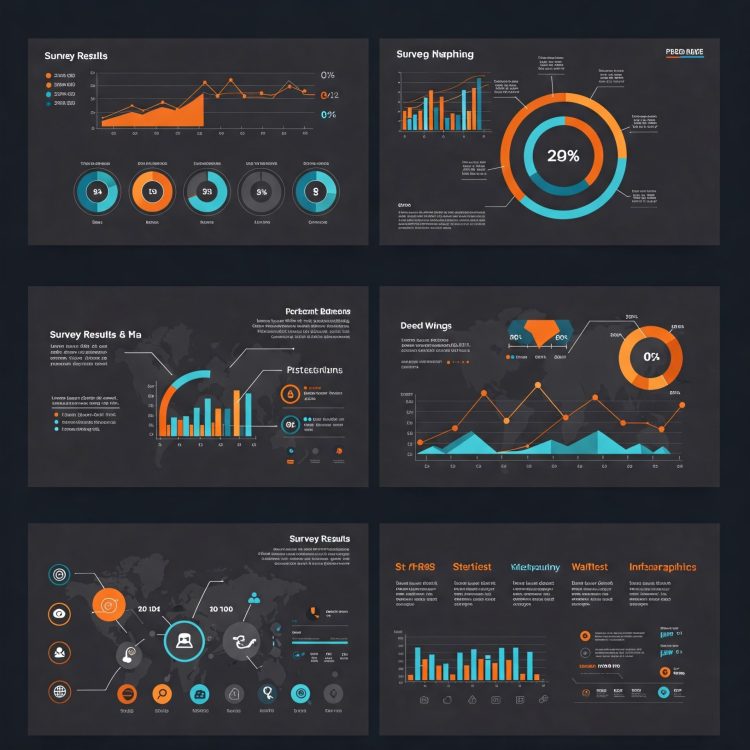
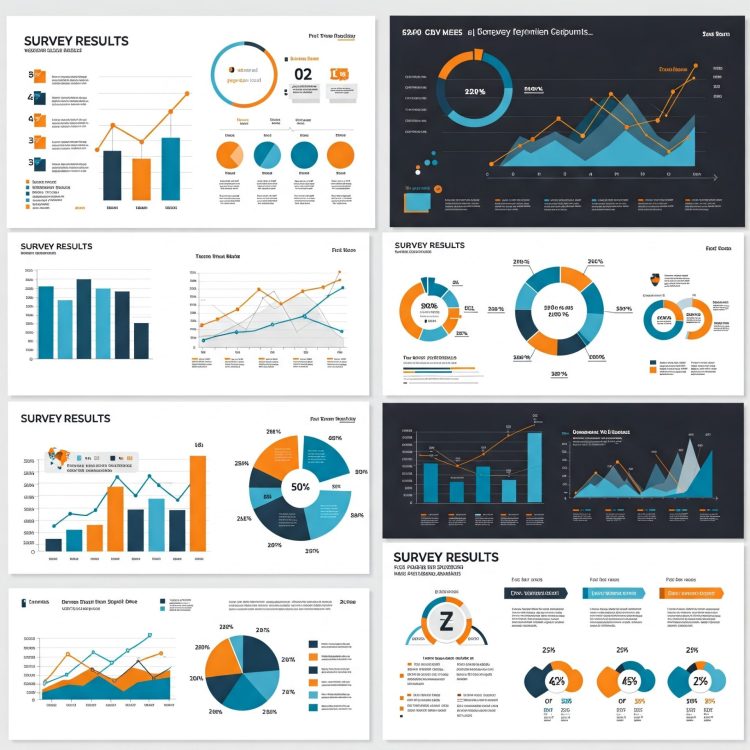
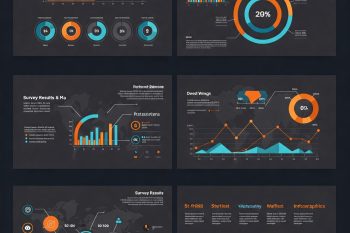
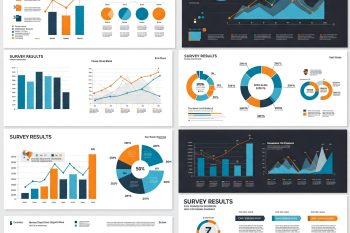
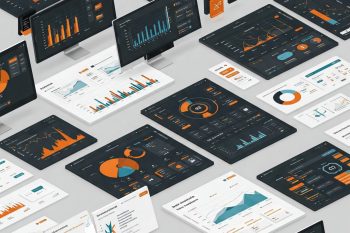
The templates include layouts for percentage breakdowns, multiple-choice results, rating scales, demographic data, and sentiment analysis visuals. With clean, professional designs, you can transform raw data into compelling visuals for reports, presentations, case studies, and social media posts.
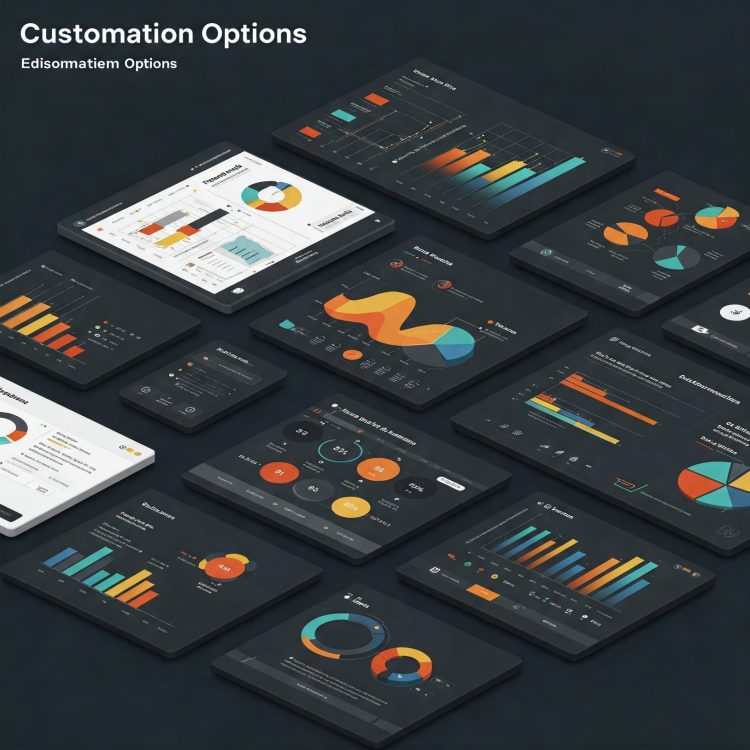
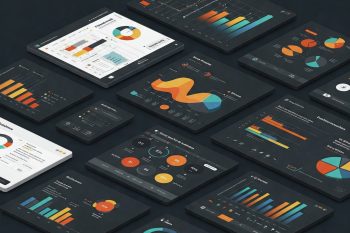
Compatible with Canva and PowerPoint, these templates are fully editable — adjust colors, text, icons, and data values to suit your project. Whether you’re reporting survey findings to stakeholders or sharing insights with your audience, this kit saves you time and ensures polished, impactful visuals.

Mark Anderson (verified owner) –
I found the Survey Results & Poll Data Infographics to be incredibly helpful. The designs are modern and appealing, making my data much easier to digest. I only wish there were more templates to choose from, but overall, very satisfied!
James Lee (verified owner) –
Great product! The infographics are well-designed and versatile. I was able to quickly adapt them for a corporate presentation. Just a slight learning curve with Canva, but nothing too difficult. Would recommend!
Linda Carter (verified owner) –
I was looking for a way to make my survey results stand out, and this kit did just that! The templates are easy to use and look professional. I especially appreciate the variety of styles available. Fantastic resource!
Emily Johnson (verified owner) –
This infographic kit is a game changer for my presentations! The editable templates in Canva and PowerPoint made it so easy to customize the data to fit my needs. Highly recommend for anyone needing to present survey results visually!
Sarah Thompson (verified owner) –
This kit has saved me so much time! I love how easy it is to edit in both Canva and PowerPoint. The visuals are eye-catching, and they helped me convey my findings effectively. Definitely worth the investment!