Help your audience make informed decisions with the Infographic Comparison Charts & Data Analysis Diagrams Multipurpose Pack. This collection is ideal for side-by-side comparisons of products, services, features, performance data, and more — perfect for business reports, proposals, and presentations.
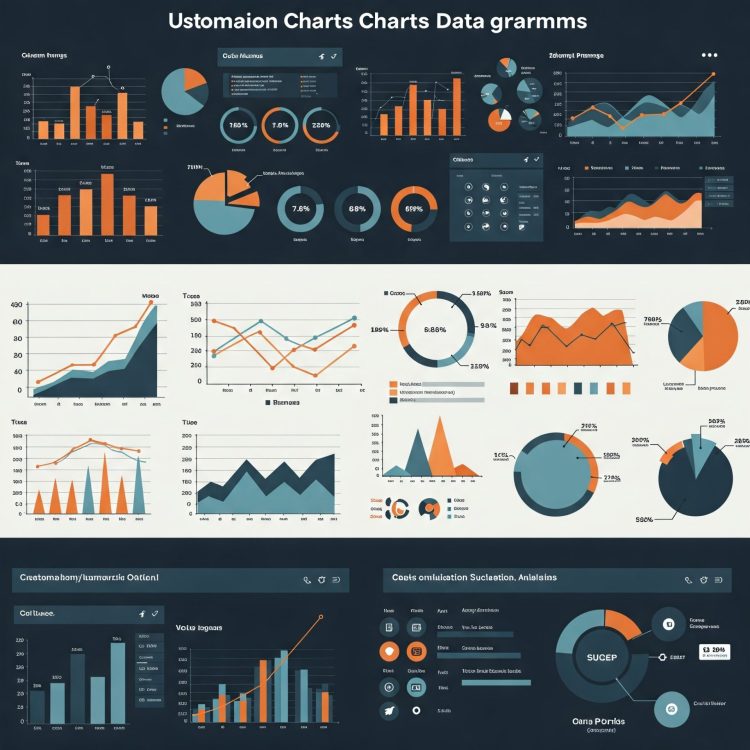
Inside, you’ll find a variety of layouts, including tables, two-column comparisons, multi-item comparison charts, and pros & cons visuals. The designs are clean, modern, and easy to customize, allowing you to highlight key differences and insights effectively.
Whether you’re comparing competitors, product features, pricing options, or analyzing business performance, these templates will save you time and ensure your data looks professional. Fully editable in Canva and PowerPoint, they’re designed for ease of use — simply plug in your data, adjust styles, and you’re ready to impress.